Graph Data Modeling - The Book
Graph data modeling is a technique which is universally applicable for both relational and NoSQL databases (graph, document, key-value, and column), leveraging cognitive psychology to improve data designs.
This book proposes a new approach to data modeling - one that "turns the inside out". For well over thirty years, relational modeling and normalization was the name of the game. One can ask that if normalization was the answer, what was the problem? There is something upside-down in that approach, as you will see in the book.
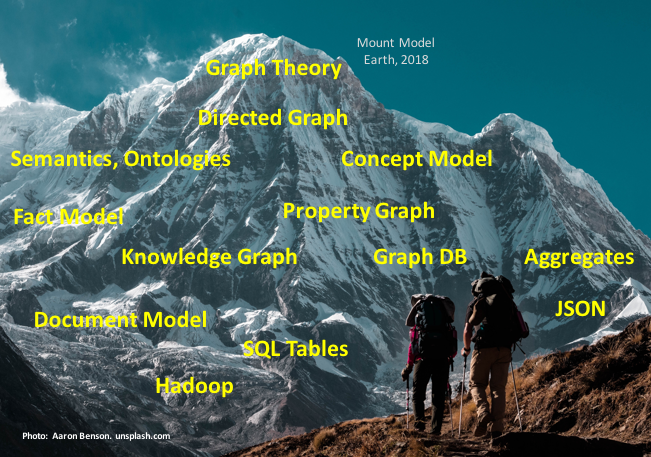
Data analysis (modeling) is much like exploration. Almost literally. The data modeler wanders around searching for structure and content. It requires perception and cognitive skills, supported by intuition (a psychological phenomenon), that together determine how well the landscape of business semantics is mapped.
Mapping is what we do; we explore the unknowns, draw the maps and post the "Here be Dragons" warnings. Of course there are technical skills involved, and surprisingly, the most important ones come from psychology and visualization (again perception and cognition) rather than pure mathematical ability.
Two compelling events make a paradigm shift in data modeling possible, and also necessary:
This book proposes a new approach to data modeling - one that "turns the inside out". For well over thirty years, relational modeling and normalization was the name of the game. One can ask that if normalization was the answer, what was the problem? There is something upside-down in that approach, as you will see in the book.
Data analysis (modeling) is much like exploration. Almost literally. The data modeler wanders around searching for structure and content. It requires perception and cognitive skills, supported by intuition (a psychological phenomenon), that together determine how well the landscape of business semantics is mapped.
Mapping is what we do; we explore the unknowns, draw the maps and post the "Here be Dragons" warnings. Of course there are technical skills involved, and surprisingly, the most important ones come from psychology and visualization (again perception and cognition) rather than pure mathematical ability.
Two compelling events make a paradigm shift in data modeling possible, and also necessary:
- The advances in applied cognitive psychology address the needs for proper contextual framework and for better communication, also in data modeling, and
- The rapid intake of non-relational technologies (Big Data and NoSQL).
Contents of the Book
The book not only introduces the graph data modeling technique. It is - in itself - a complete practitioners guide to best practise data modeling.
Chapter 2 covers the background of data modeling. Considers the roles of data modeling in big data and NoSQL solutions. We also explore relational and other widespread paradigms. The book also highlights some specific concepts of human cognitive systems and of our ways of dealing with our surroundings, including cognition and visualization.
Chapter 3 describes our understanding of the true requirements of data modeling.
This chapter outlines the end user’s actual spatial and conceptual needs. The chapter ends with a list of the real requirements of a data modeling solution.
Chapter 4 describes the proposed data modeling solution, which fulfills the requirements collected in chapter 3. It describes how property graphs can be used with concept models to collect meaning and structure. Solution modeling for specific project data models is finally followed by transformation, optimization, and deployment for a number of different physical data store targets.
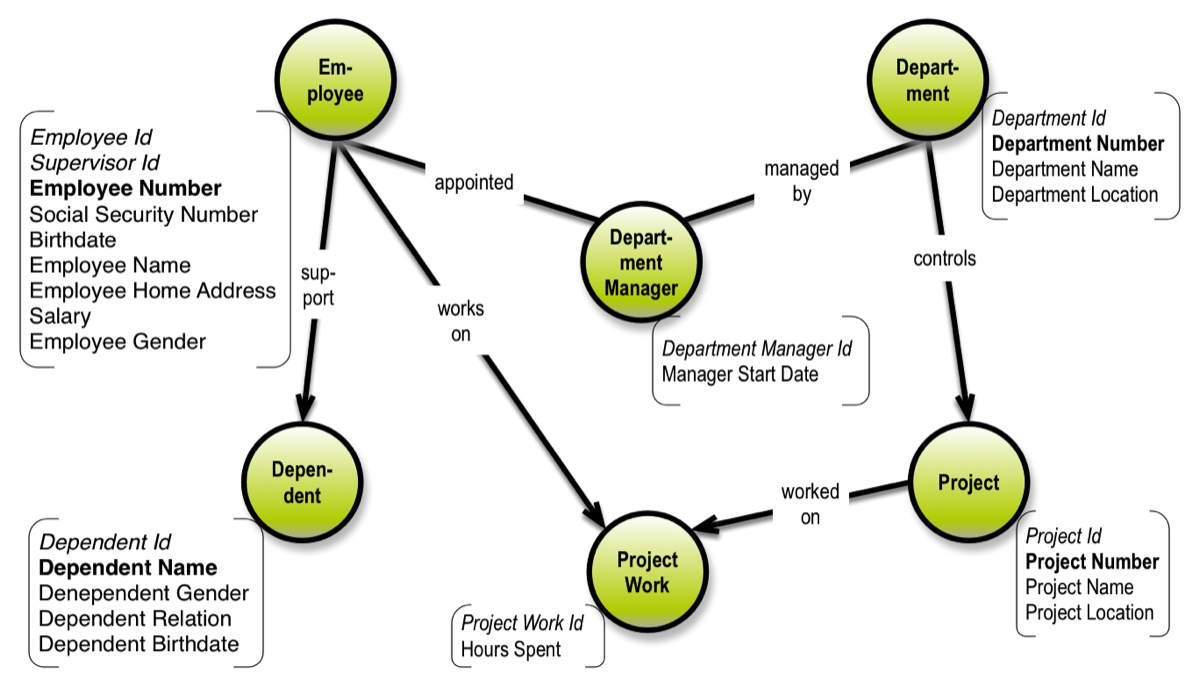
Chapter 5 walks through a few detailed examples.
Chapter 6 concludes and helps you pack a “mental backpack” for your journey into the “data modeling zone,” preparing you to explore business semantics.
The emphasis of the book is on solution data modeling (the “logical” level). Many of the new technologies are more or less proprietary, meaning that on the physical level we can only provide general directions in a book like this.
Chapter 2 covers the background of data modeling. Considers the roles of data modeling in big data and NoSQL solutions. We also explore relational and other widespread paradigms. The book also highlights some specific concepts of human cognitive systems and of our ways of dealing with our surroundings, including cognition and visualization.
Chapter 3 describes our understanding of the true requirements of data modeling.
This chapter outlines the end user’s actual spatial and conceptual needs. The chapter ends with a list of the real requirements of a data modeling solution.
Chapter 4 describes the proposed data modeling solution, which fulfills the requirements collected in chapter 3. It describes how property graphs can be used with concept models to collect meaning and structure. Solution modeling for specific project data models is finally followed by transformation, optimization, and deployment for a number of different physical data store targets.
Chapter 5 walks through a few detailed examples.
Chapter 6 concludes and helps you pack a “mental backpack” for your journey into the “data modeling zone,” preparing you to explore business semantics.
The emphasis of the book is on solution data modeling (the “logical” level). Many of the new technologies are more or less proprietary, meaning that on the physical level we can only provide general directions in a book like this.

The essential Take-Aways from reading the Book about Graph Data Modeling
Data modeling is a journey into lands of the unknown. A journey of exploration, discovery, and mapping. Every capable discoverer knows that there are certain things you must keep with you at all times. Here are my best bets on concepts you should keep in your “mental backpack,” wherever your modeling efforts take you.
The priorities are:
1) Structure
2) Content.
Remember that structure is top priority, but the combination of structure and content is what meaning is made of.
Today, the demand for a 3-layered modeling approach is more important than ever before. When relational modeling was dominant, everything melted into a pot of “table soup,” which was called a variety of things such as entity relationship, conceptual, logical and more. This is no longer an option, since many projects are now being based on physical models without tables.
The distinction between the business layer (i.e. concept models) and the solution layer is that the business layer is a map of reality, whereas the solution layer is a design artifact effectively scoping a particular IT solution (probably containing a number of generalizations and/or other design decisions).
Tables are in the wrong place, if they participate in data models. They are basically external views (in the ANSI-SPARC terminology), designed to represent data in a user interface (e.g. a screen, a form, a grid). Such applications are where tables excel, just look at Excel. Using tables in physical representation is a possibility, but just one among many (like aggregates, key-values and graphs).
The purpose of all this effort is to create business value. Put that idea on top in your backpack! This is ultimately why data modeling is important. Since businesses are run by humans, they are somewhat “fluffy.” This is why it’s critical to understand and apply cognitive and psychological findings. Learning is a big part of data modeling; psychologists have been busy for over 50 years. Being “fluffy” also means that issues such as uniqueness and identity can have exceptions in the real world. So be flexible!
Cognitive computing (including semantics and machine learning) is rapidly evolving, within metadata capture and automated data modeling. This could change the “Analyze” phase from being explorative and people-oriented to be a more automated "data preparation" approach. Automated discovery of relationships is the “next big thing” in data modeling, and graphs are excellent for visualizing relationships.
Read the book and have fun!
Is anyone using Graph Data Modeling? Check the Graph Data Modeling Hall of Fame!
New: Online Training in Graph Data Modeling is now available! Click here: