Here be the Hall of Fame of Vendors, who were firsts movers by using Graph Data Modeling in their Products!
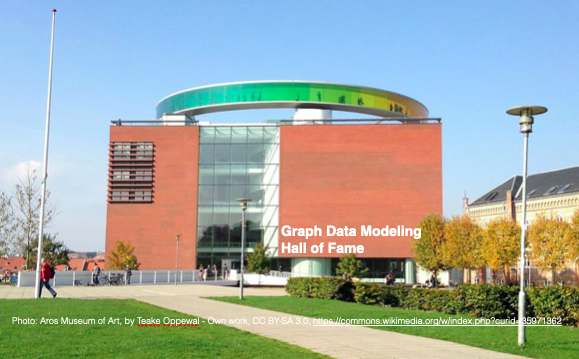
This Hall of Fame is for exquisite tools, which use Graph Data Modeling in a visual manner to express the structure and meaning of a data model. The list was maintained until mid-2020. At that time the use of graph model visualization had exploded - too large a market to mention all. The latest addition in 2020 was Cinchy, which is a data collaboration platform.
So, these fine products earned their pioneering place in the hall:
To qualify for a place in the Hall of Fame, a product should use visual, interactive, graph representation of a data model. The framing of the context is the property graph model as defined here, but plain directed graphs or hybrids were also welcome.
Anzo from Cambridge Semantics
In Cambridge Semantics Anzo Smart data lake offfering in-Memory Knowledge Graphs is embedded. Under the name AnzoGraph it offers context and meaning at unprecedented scale.
Cambridge Semantics leads the market in connected data analytics on Enterprise Knowledge Graphs. Our breakthrough AnzoGraph™ is the most advanced of its kind – performing complex ad-hoc, OLAP interactive and batch queries at connected data scales and performance levels that our competition simply cannot match.
The company declares:
2018 - The Year of the Graph!
Cambridge Semantics' homepage can be found here. The company was founded in the US.
Cinchy
Cinchy is a Data Collaboration platform that uses Data Fabric technology to connect unlimited data sources within a networked architecture, consolidate Data Management and Data Protection, and offer "persistence-as-a- service” for the delivery of real-time solutions.
A Data Fabric is the engine that accelerates Digital Transformation and is used to power hundreds of real-time solutions in half the time and cost of traditional approaches.
A Data Fabric is the engine that accelerates Digital Transformation and is used to power hundreds of real-time solutions in half the time and cost of traditional approaches.
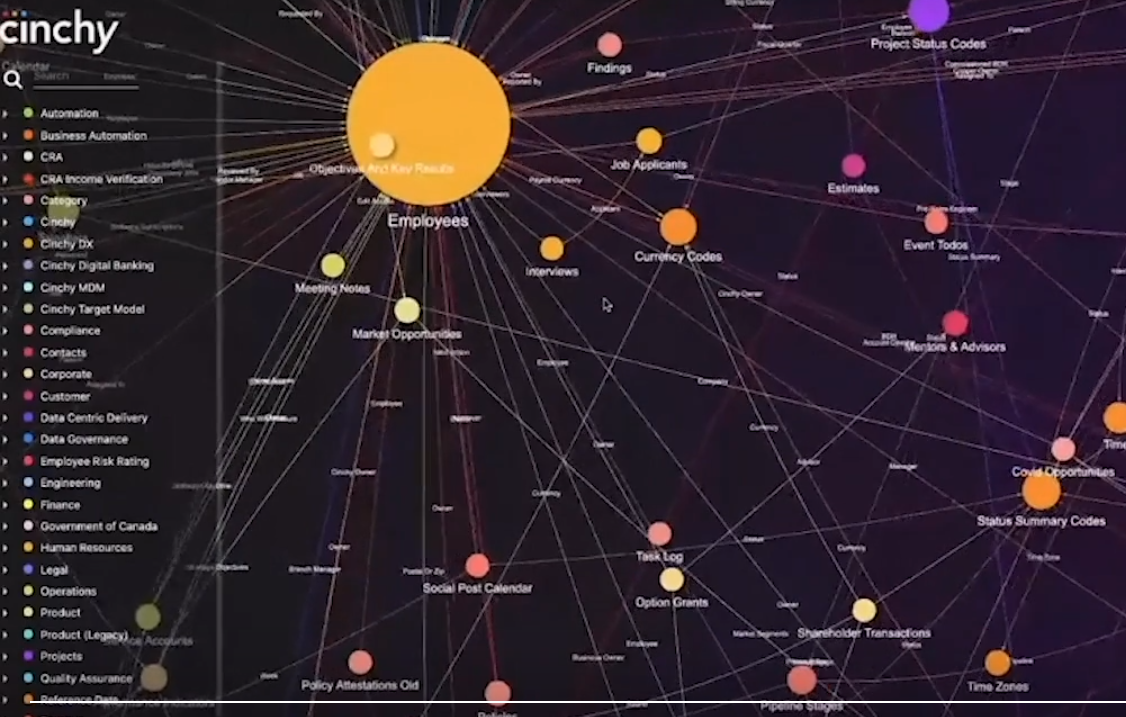
Cinchy is a Canadian company and it's homepage can be found here.
DataGalaxy
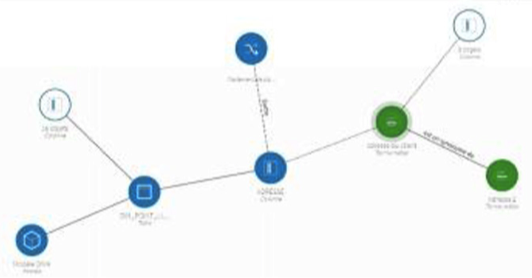
DataGalaxy is a French provider of a data modeling / catalog / business vocabulary solution. It is designed for self-service and collaboration. It is designed for agile environments and also contains a flow designer, a search engine and visual analysis (of e.g. lineage) using graph representations.
DataGalaxy's homepage is in French only and can be found here. The company was founded in France.
DataStax
DataStax Delivers:
It starts with a human desire, and when a universe of technology, devices and data aligns, it ends in a moment of fulfillment and insight. Billions of these moments occur each second around the globe. They are moments that can define an era, launch an innovation, and forever alter for the better how we relate to our environment. DataStax is the power behind the moment. Built on the unique architecture of Apache Cassandra™, DataStax Enterprise is the always-on data platform and has been battle-tested for the world’s most innovative, global applications.
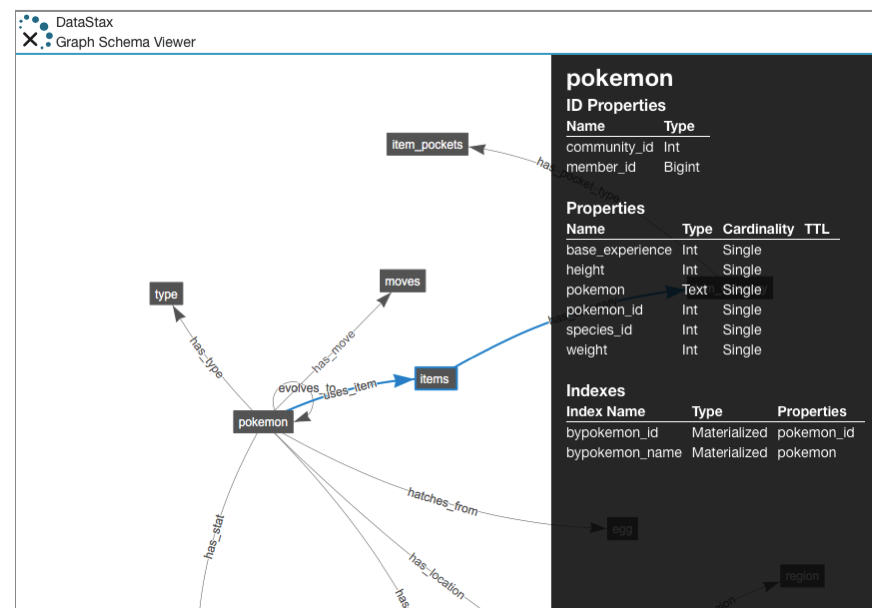
Visually Interact with Database Schemas (in DataStax Studio):
Visual representations of your schema objects help you understand your models and build them quicker. Navigating and managing complex database schemas can be difficult. To help you easily identify design or model bottlenecks, optimize queries and save time, DataStax Studio also allows you to interact with multiple clusters.
It starts with a human desire, and when a universe of technology, devices and data aligns, it ends in a moment of fulfillment and insight. Billions of these moments occur each second around the globe. They are moments that can define an era, launch an innovation, and forever alter for the better how we relate to our environment. DataStax is the power behind the moment. Built on the unique architecture of Apache Cassandra™, DataStax Enterprise is the always-on data platform and has been battle-tested for the world’s most innovative, global applications.
Visually Interact with Database Schemas (in DataStax Studio):
Visual representations of your schema objects help you understand your models and build them quicker. Navigating and managing complex database schemas can be difficult. To help you easily identify design or model bottlenecks, optimize queries and save time, DataStax Studio also allows you to interact with multiple clusters.
DataStax's homepage can be found here. The company was founded in the US.
Factgem
The Core of FactGem's offering is the DATA FABRIC:
The FactGem Data Fabric connects data from platforms and applications, separated by purpose, geography, or organization, into a unified, service-enabled, graph endpoint.
Stored as a cohesive and visual model, data can be expressed as the entities, relationships, transactions, and events that tie them together, providing for easy reporting and querying across the enterprise.
Relationships become first-class citizens in the FactGem Data Fabric. They aren’t just an index or a way to link disparate entities together. They can be queried directly.
See more here on Youtube: FactGem Product Overview
See more here on Youtube: FactGem Product Overview
FactGem's homepage is here. The company was founded in the US.
Factil
Factil Information Modeling Platform
We help businesses to take a model-driven approach to tackle the complexity of information modeling and data integration in relational, data warehouse and NoSQL data environments.
With our platform, the enterprise business information model is defined in an easily understood, controlled natural language. From the business information model, the platform can generate well-structured data schemas in a number of forms, transformation code between these forms, and associated artefacts such as business glossaries and data dictionaries.
The platform provides:
Web-based Business Information Model editor
Automated model inference from from source metadata
Automated schema generation to relational, staging and data vault forms
Automated transformation code generation from application to staging, staging to raw data vault and raw data vault to business data vault schemas
Automated documentation generation including Business Glossary, Logical Data Model and export to ER modeling tools
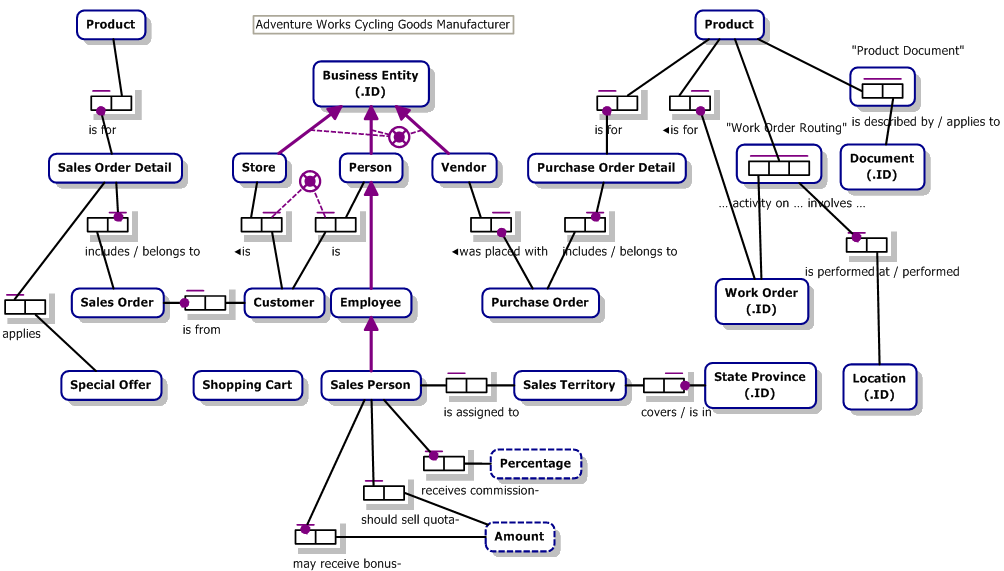
Factil comes out of the strong, Australian, fact based modeling community. The Factil platform contains different kinds of representations, also including data vault capabilities. What is shown here is the business level ORM (Object Role Model) diagram style, which has been around for quite some years, and which I admit do have some strong points. My primary disagreement lies in the area of simplicity and intuitiveness (which is hindered by the visual syntax elements). I do recommend approaches like this very complex tasks like for example complex public service systems or systems designed to take equipment to Mars (or other places where failure is not an option).
Factil's homepage is here. The company was founded in in Australia.
Grafo
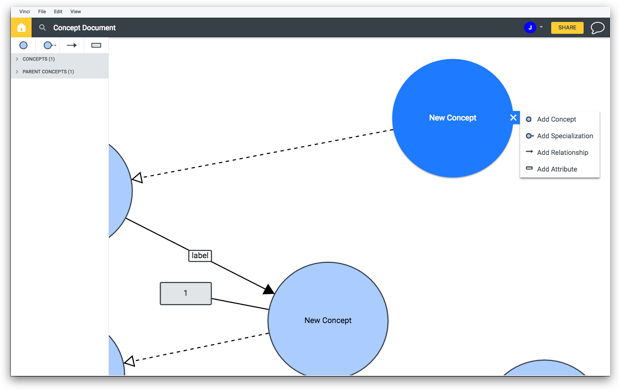
Grafo lets you design knowledge graphs the same way you present them: visually.
Connect your concepts
It should be easy to design a knowledge graph, but existing products - while powerful - are frequently difficult to use. We've designed a system from the ground up for ease of use, while ensuring that it remains robust enough to develop incredibly complex data models.
Say hello to Grafo.
Complete Toolkit
Everything you need to create, manage, and evolve your Knowledge Graphs: RDF & Property Graph.
Invite your team to edit your documents with you in real-time.
Participate in threaded comments at the object level.
Every change is tracked. View and revert to old versions effortlessly.
Import and Export both OWL and TTL documents. More formats coming soon.
Quickly search and find concepts, attributes and relationships in your document.
Commercial solutions hosted in world class cloud infrastructure. Performant, secure and reliable.
Economical
Grakn AI
Grakn is the knowledge graph engine to organise complex networks of data and making it queryable, by performing knowledge engineering.
Rooted in Knowledge Representation and Automated Reasoning, Grakn provides the knowledge foundation for cognitive and intelligent (e.g. AI) systems, by providing an intelligent language for modelling, transactions and analytics. Being a distributed database, Grakn is designed to scale over a network of computers through partitioning and replication.
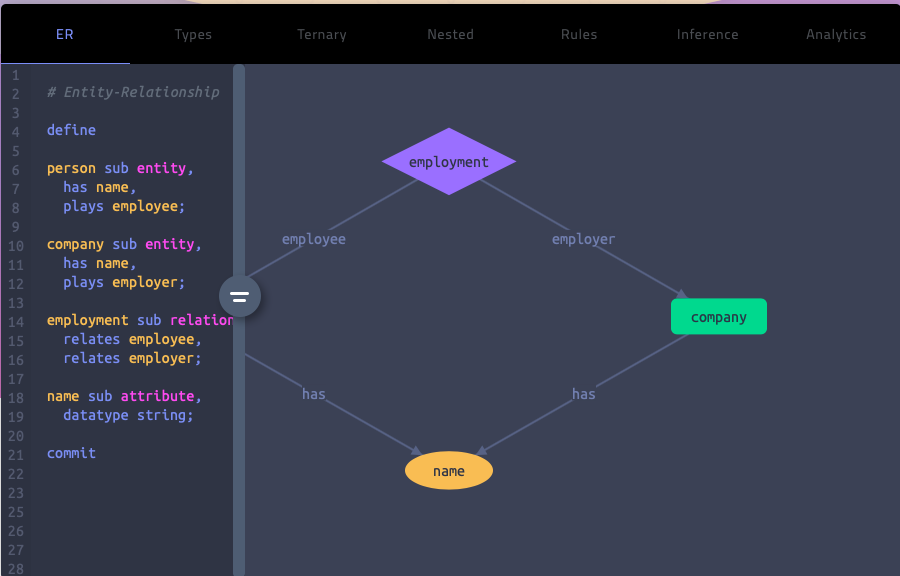
Grakn allows you to model your domain using the well-known Entity-Relationship model at its full expressivity. It is composed of entity types, relationship types, and attribute types.
Unlike other modelling languages, Grakn allows you to define type hierarchies, hyper-entities, hyper-relations, and rules to build rich knowledge models.
The schema is defined by way of a visual knowledge schema editor:
Rooted in Knowledge Representation and Automated Reasoning, Grakn provides the knowledge foundation for cognitive and intelligent (e.g. AI) systems, by providing an intelligent language for modelling, transactions and analytics. Being a distributed database, Grakn is designed to scale over a network of computers through partitioning and replication.
Grakn allows you to model your domain using the well-known Entity-Relationship model at its full expressivity. It is composed of entity types, relationship types, and attribute types.
Unlike other modelling languages, Grakn allows you to define type hierarchies, hyper-entities, hyper-relations, and rules to build rich knowledge models.
The schema is defined by way of a visual knowledge schema editor:
Grakn is based on an underlying hypergraph DBMS and it supports (among other things) the Apache Tinkerpop property graph interface.
Grakn's homepage is here. Grakn is open source. The company is based in the UK.
Graphileon
Graphileon helps business consultants and information analysts to rapidly design and deploy graph-based applications by exploiting the agility of graphs.
Graphileon use cases: Graphs are on the rise. Graphileon offers the tools to easily use them in a wide range of situations. Consultants use Graphileon to model data and to create (prototype) applications and developers do their magic using the integrated javascript libraries. In addition, Graphileon empowers others to offer solutions to extremely graphy problems.
One of the use cases is user-friendly and controlled data-management!
Using a Schemabuilder and a Databuilder to control the categories of users that are allowed to add new attributes to nodes and relationships, while providing other users with access to forms to enter data.
One of the advantages of property graphs like Neo4j, in which both nodes and relationships can have properties, is their versatility and freedom with regard to create and update models. However, this freedom comes with responsibility. Sometimes you may want to control the categories of users that are allowed to add new attributes to nodes and relationships, while you want to provide other users access to forms to enter data.
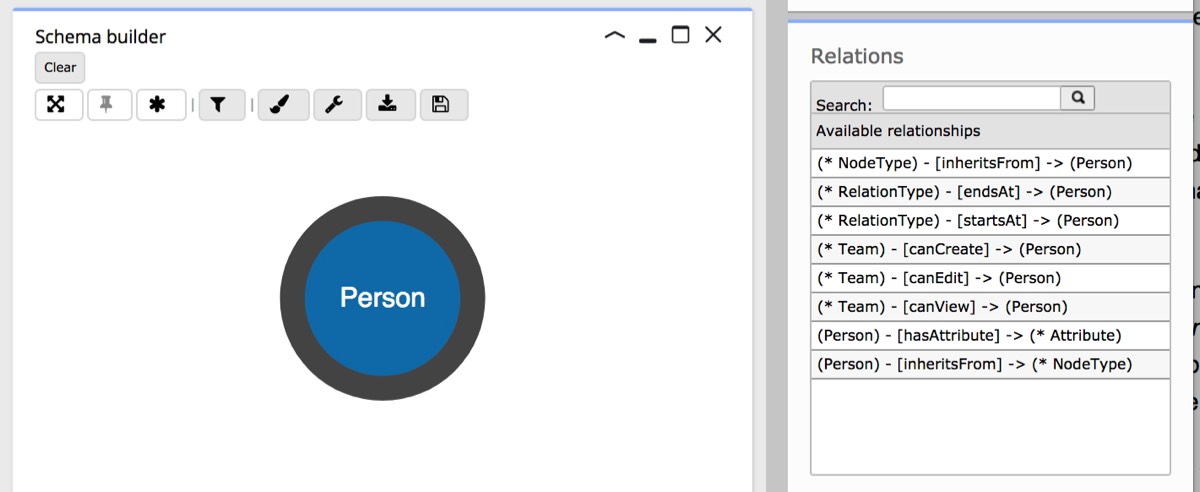
In the Schemabuilder (above), nodetypes and relationtypes are created, then linked to attributes with different datatypes (string, integer etc). Graphileon takes care of storing the schema, if needed in a separate graph store. Both nodetypes and relationtypes can inherit attributes.
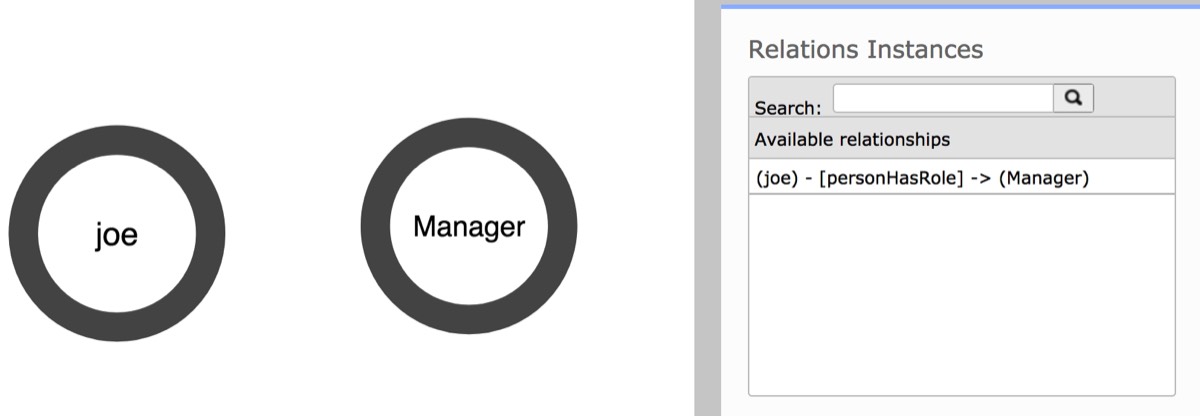
When selecting two nodes, the Databuilder displays the relations (cf. above) that are allowed according to what is defined in the schema.
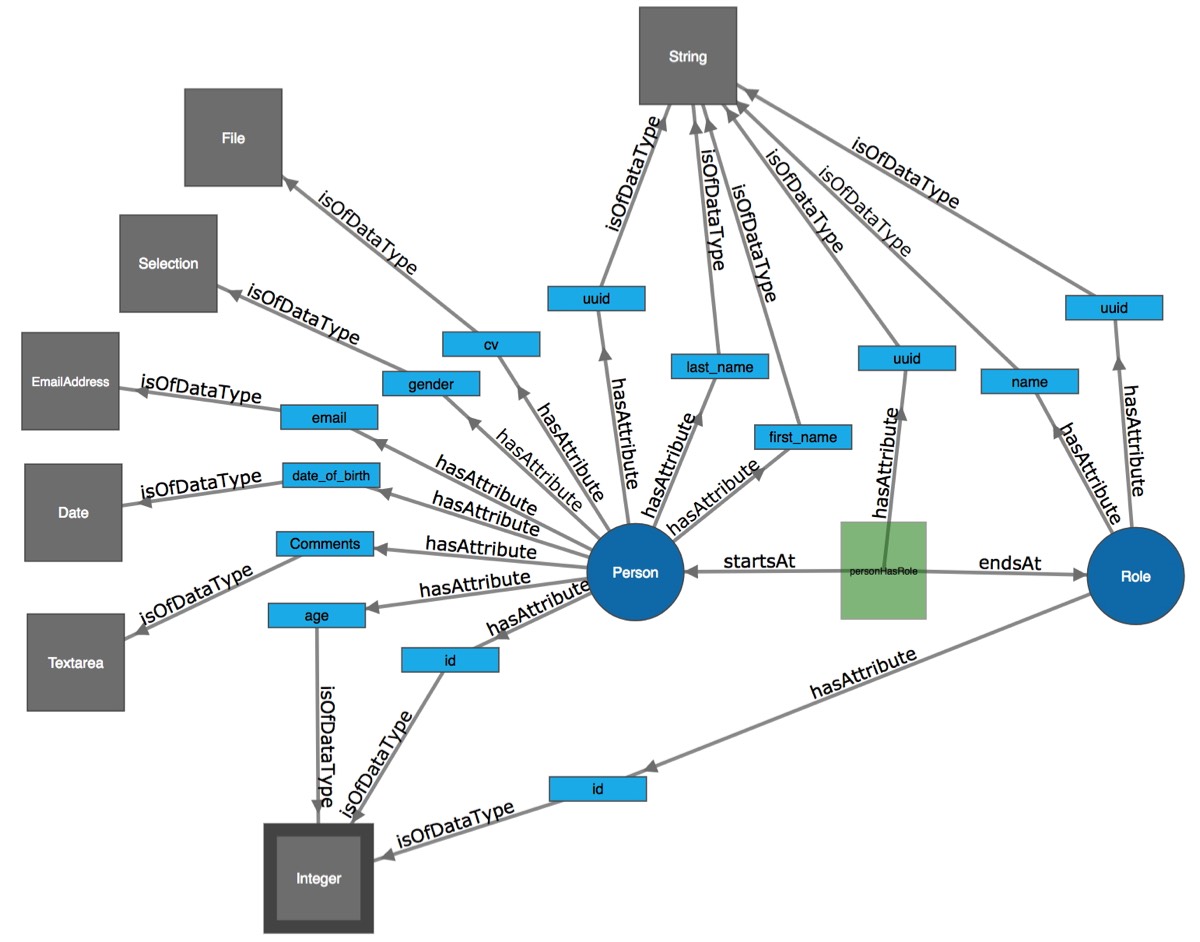
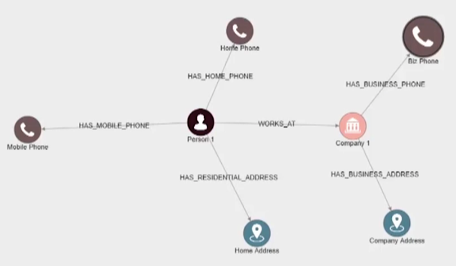
For a :Person nodetype, with attributes of different types, the schema could look like the graph data model above.
These components of Graphileon are real data modeling tools for Neo4j property graph database design. but they are not supported in the personal (free) edition. Read more about them here.
Graphileon is based in the Netherlands. Their homepage is found here.
GraphQL Voyager
Represent any GraphQL API as an interactive graph. It's time to finally see the graph behind GraphQL. You can also explore number of public GraphQL APIs from our list.
With graphql-voyager you can visually explore your GraphQL API as an interactive graph. This is a great tool when designing or discussing your data model. It includes multiple example GraphQL schemas and also allows you to connect it to your own GraphQL endpoint. What are you waiting for, explore your API!
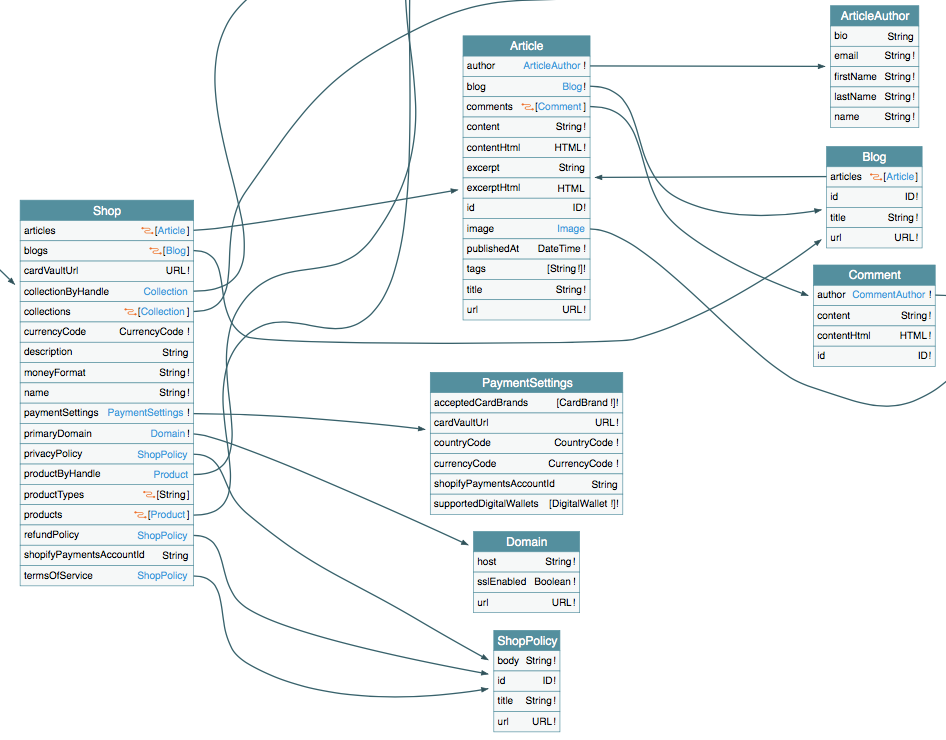
GraphQL Voyager is based on one of the earlier ERD diagramming libraries, as you can see.
See an interactive demo here: GraphQL Voyager
See an interactive demo here: GraphQL Voyager
GraphQL Voyager is open source (MIT license) based on Github here. The company behind is apis.guru, based in Ukraine.
The project was inspired by GraphQL Visualizer , developed by Nathan Smith, based in the US.
A rather similar project is GraphQL Rover, which is based on Dagre-D3 and Vue.js. GraphQL Rover is developed by Francesco De Lisi, based in Thailand.
The project was inspired by GraphQL Visualizer , developed by Nathan Smith, based in the US.
A rather similar project is GraphQL Rover, which is based on Dagre-D3 and Vue.js. GraphQL Rover is developed by Francesco De Lisi, based in Thailand.
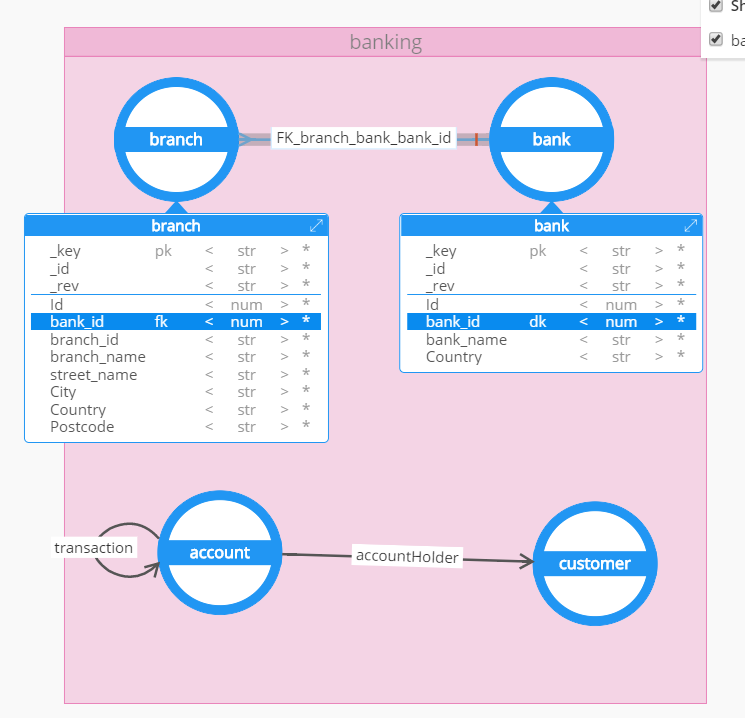
Hackolade
Hackolade offers agile visual data modeling for JSON, NoSQL, and multimodel databases , and it now supports Neo4j graph data models as well.
It was specifically built to support the data modeling of Neo4j node labels and relationship types. The application closely follows the terminology of the database. To be clear, Hackolade is not a graph visualization tool, but a tool for data modeling of Neo4j graph databases - and many other databases, most lately ArangoDB.
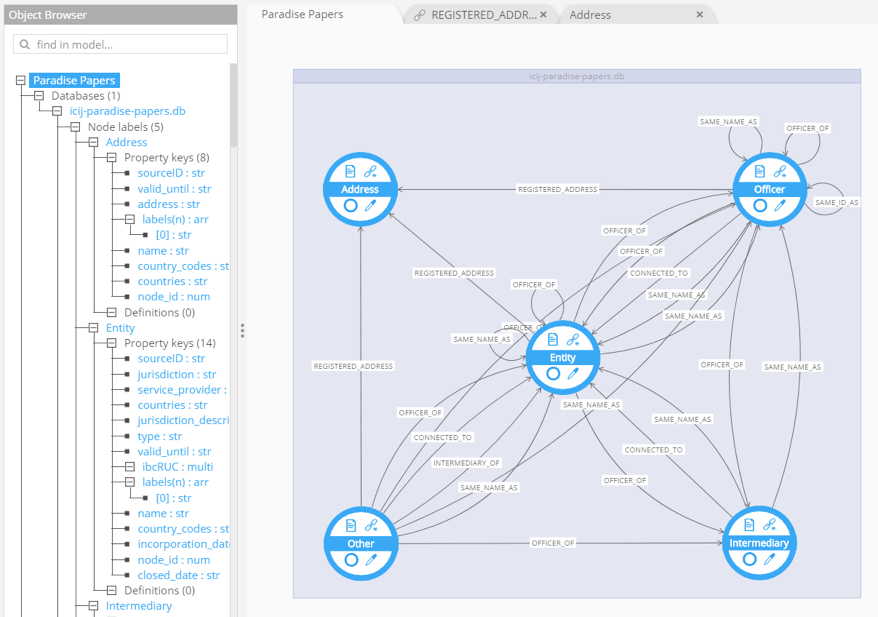
The new Neo4j graph data modeling interface looks very nice and it offers comprehensive coverage of the graph data modeling features of graph databases in Neo4j. Nice job! I will do a more elaborate review as time permits.
Recently Hackolade introduced for ArangoDB, and here is a nice solution to the drop-down display of properties:
Recently Hackolade introduced for ArangoDB, and here is a nice solution to the drop-down display of properties:
Hackolade is a product of IntegrIT SA/NV, and its' homepage is found here. The company is based in Belgium.
Hume
Hume (from GraphAware) is a Graph-Powered Insights Engine. It creates a digital twin of your business in the form of a Collaborative Knowledge Graph which surfaces critical but previously buried and undetected relevance in your organization.
This newly accessible relevance can be surfaced and used in a variety of ways including unusually accurate and even predictive search, dynamic conversation and chat, proactive alerting on potentially high-impact unknowns, accurate connectedness recommendations, as well as advanced analytics and context aware visual exploration.
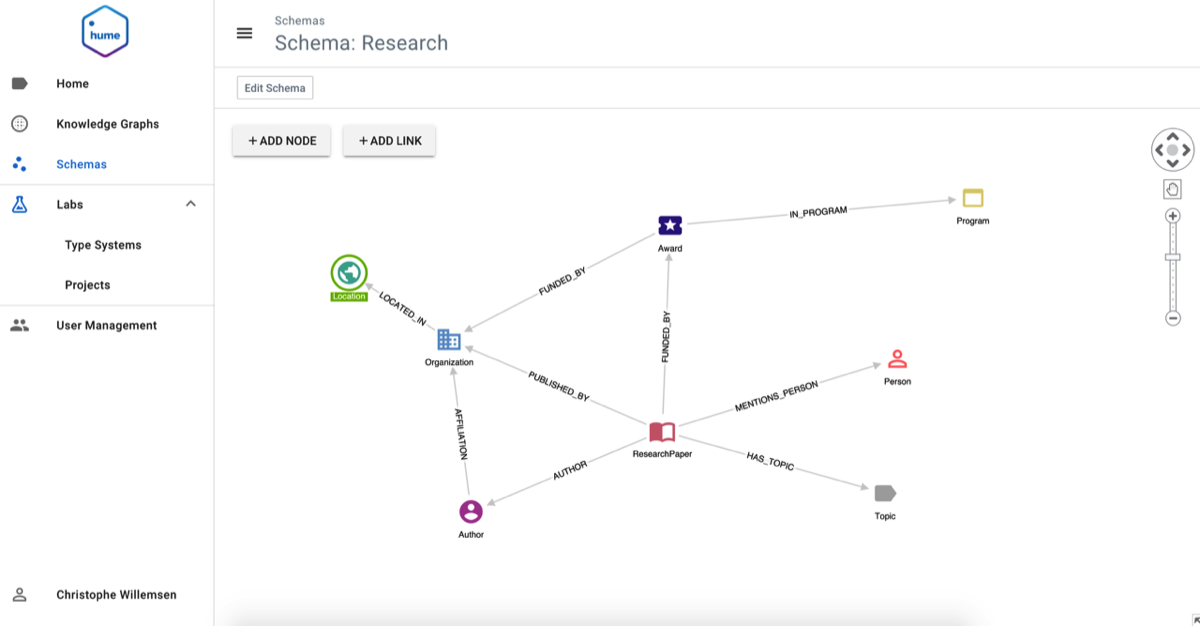
The image above show a schema within the knowledge graph structure of Hume.
Hume is a product of GraphAware, and Hume's' homepage is found here. The company is headquartered in London with 7 offices worldwide.
Informatica
Informatica offers a range of solutions for Master Data Management, Data Governance, Data Discovery and more.
One of the offerings is Enterprise Information Catalog: A machine-learning-based data catalog lets you classify and organize data assets across cloud, on-premises, and big data.
One of the offerings is Enterprise Information Catalog: A machine-learning-based data catalog lets you classify and organize data assets across cloud, on-premises, and big data.
The graph snippet above is from Informatics's Enterprise Information Catalog and shows the graph support in the Domain Management part.
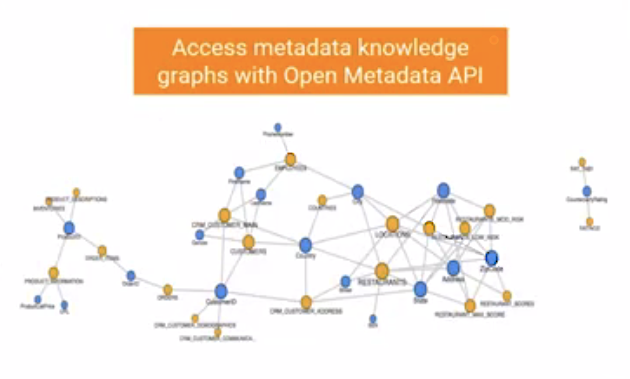
The graph above illustrates that there is an open metadata API to the information catalog.
And the graph below is from Relate 360, a Big Data approach to MDM designed to discover and infer non-obvious relationships in big data, visualize households relationships, customer groups, and social networks and to connect master data to transaction, interaction and Internet of Things data.
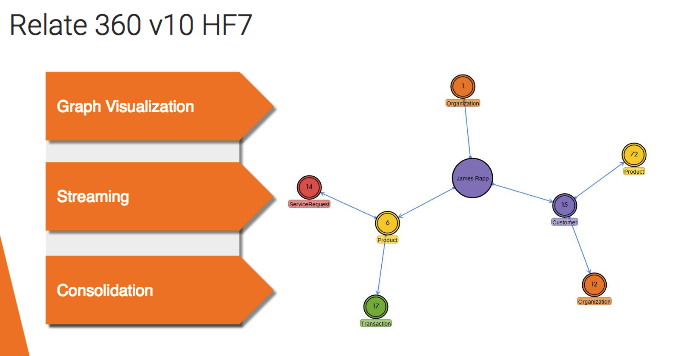
Graph technology is applied in more and more of Informatica's offerings, and the trend is growing. Informatics's homepage is here. The company was founded in the US.
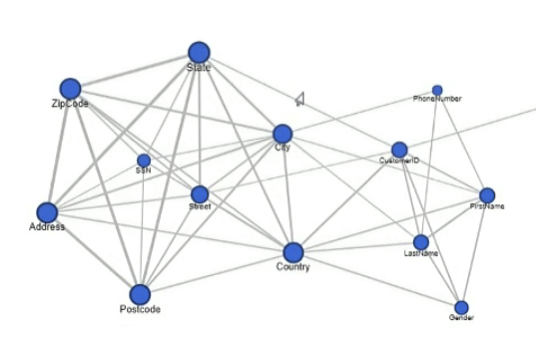
Io-Tahoe
Discover, search and catalog your data
Io-Tahoe’s Smart Data Discovery and AI-Driven Data Catalog solutions make it simple for organizations to automatically discover and search all their enterprise data. Our easy to use platform provides everyone with the ability to derive insights from their data.
The product uses graph visualization in many places, as can be seen below.
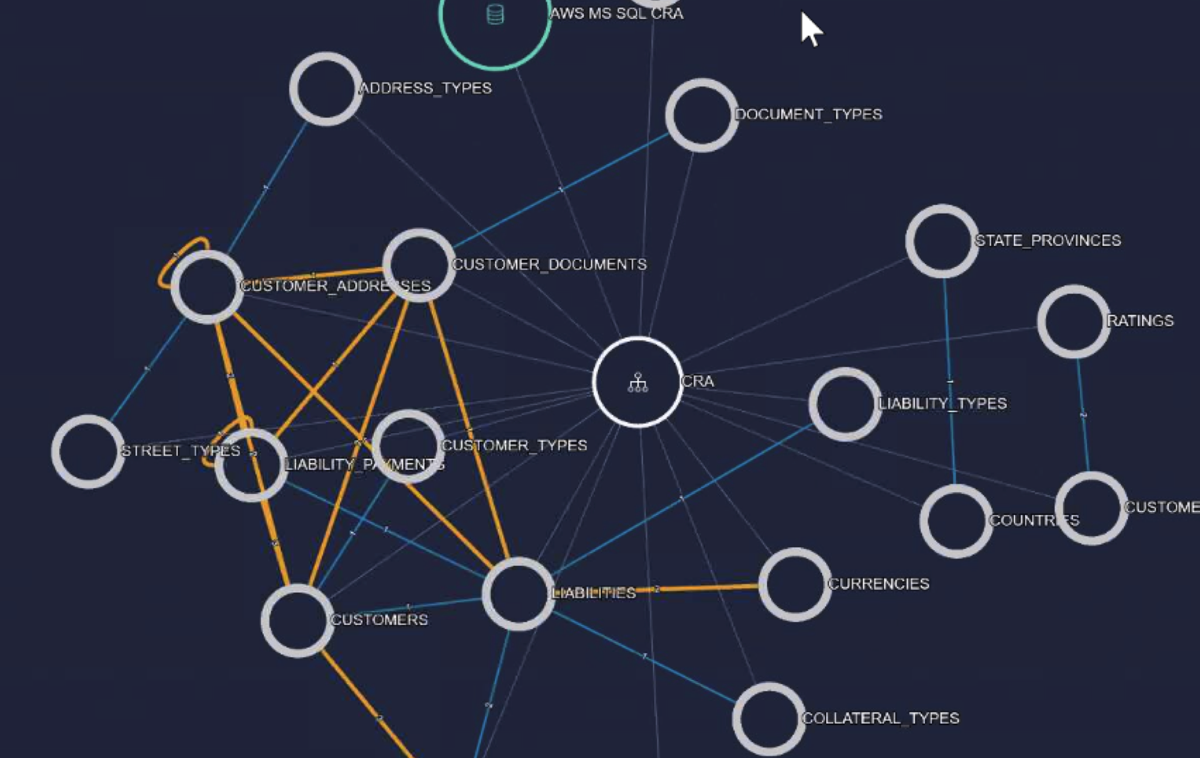
Structural relationships are visualized as graphs in different discovery modules of the product. You can see more on their homepage, here.
Io-Tahoe is based in the US.
Io-Tahoe is based in the US.
Maana
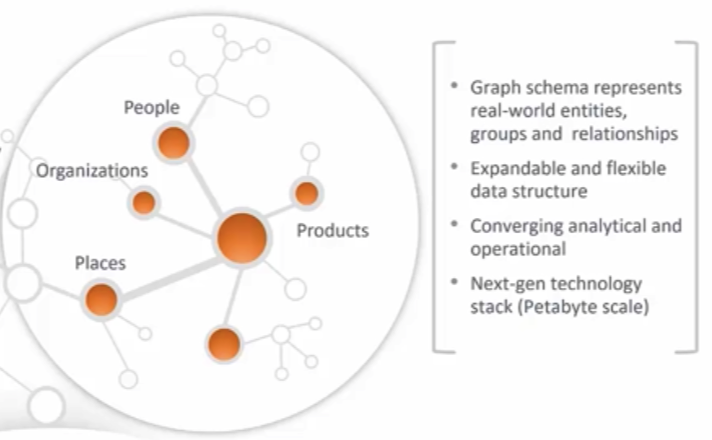
Maana's vision is to encode the world’s industrial expertise and data into new digital knowledge for millions of experts to make better and faster decisions.
With that vision Maana has pioneered the Maana Knowledge Platform™, a knowledge-centric technology that has been developed over the past 4 years, while solving the most complex operational challenges of Global Fortune 500 industrial companies. The Maana Knowledge Platform turns human expertise and data into digital knowledge for employees to make better and faster decisions.
The "secret sauce" is the patented Knowledge Graph™ — the invention at the core of the platform that combined with Maana’s algorithms, expedite extracting knowledge from data silos and information sources, to reveal their relationships in the context of optimizing assets and processes.
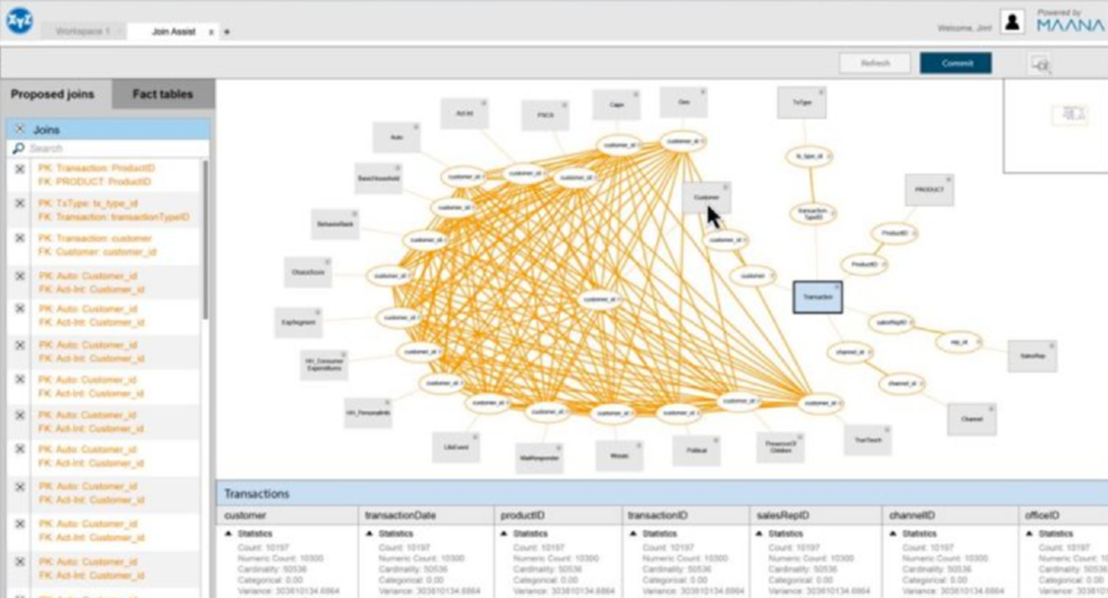
JoinAssist guides users in finding non-obvious relations, even when the user does not fully understand their data relationships. Often, users have a good understanding of the available data, but the effort to manually connect it all to create large data models is difficult and time consuming. Maana’s user-guided, machine-assisted mechanism provides a visual interface to automatically build the relevant joins – and with little manual intervention.
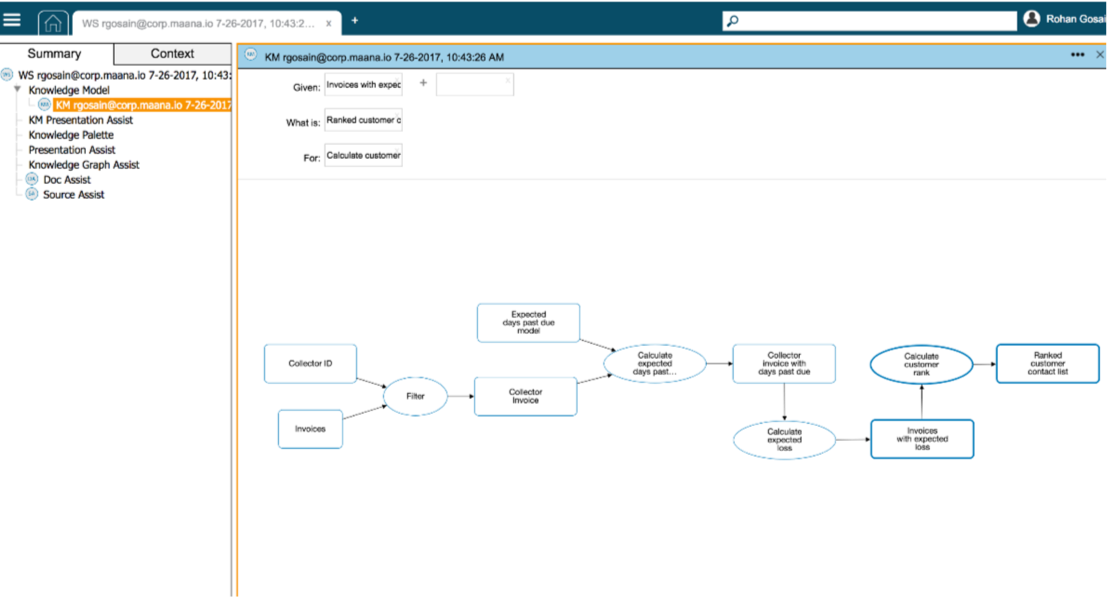
KnowledgeModelAssist: Visually build knowledge models – the fundamental building blocks for Knowledge Applications – from pertinent “problem” questions such as, “Given a vessel, omitted port, and date, what are the set of alternative port options ranked by score?” With KnowledgeModelAssist, you can search concepts, bring them into the workspace, define relationships between them and apply appropriate functions in order to digitize your subject-matter expertise.
Graph visualization is applied all over the Maana platform. Manaa's homepage is here. The company was founded in the US.
Neo4j
Neo4j is the leading graph data platform.
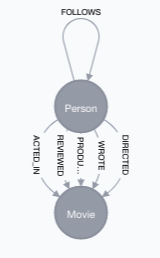
Although it does not require a schema or a declared data model, it does have a function called "db.schema()". It will analyze the data and infer the schema from the data.
Neo4j (and other graph databases) are actually great for building metadata repositories.
To the right you see the inferred schema of the IMDB movie database. It is displayed in the standard, built-in graph data browser, which is part of the platform.
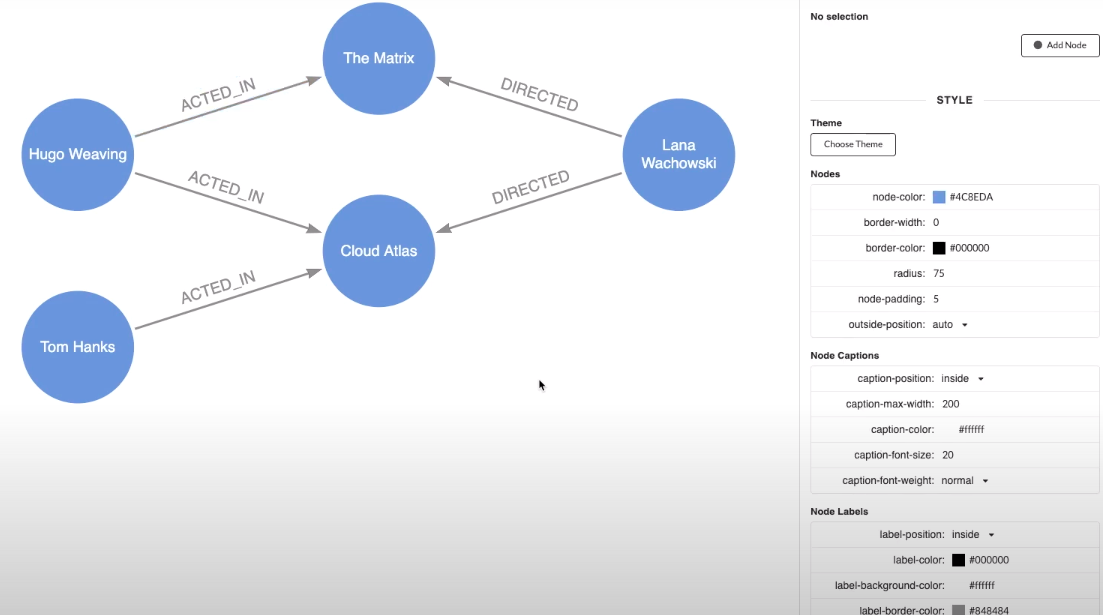
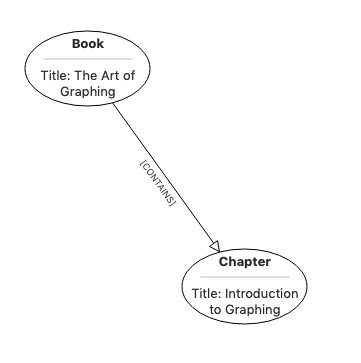
Neo4j Labs offers a forward engineering graph modeling tool called arrows.app. It is nice and simple and offers features like:
Here is a little example of the style of graph diagram that you can develop using arrows:
- Quick Intuitive drawing with a mouse.
- Neo4j Property Graph Model Draw: nodes, relationships, properties, labels.
- Fine-grained Styling Control: sizes, layouts, colors.
- Export as image or Cypher Use images in documents or presentations. Run Cypher to create graphs in Neo4j.
Here is a little example of the style of graph diagram that you can develop using arrows:
Neo4j's homepage is here. The company was founded in Sweden, so it is a "New Nordic" software company!
Nodeera
John Singer, Founder and CEO says this about NodeEra, which is an open source product today:
"After 35 years of working with relational databases, I discovered Neo4j and the property graph data model. Like you, I could see the advantages of this new approach to representing information in a database.
While the property graph won’t be replacing all relational databases (yet), it is particularly well suited for what I was working on.
As a relational data modeler, data analyst, DBA, I soon discovered that Neo4j lacked the types of tools I was used to working with – data modeling and query management – so I set out to build the tools I wish I had and NodeEra was born!
One of the exciting aspects of Neo4j’s property graph model is it’s “schema-on-demand” design. NodeEra implements this dynamic, iterative approach to property graph design that I believe you will find useful, more productive, and best of all – fun!"
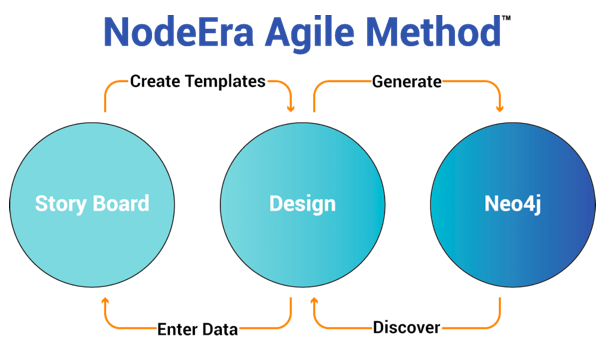
Nodeera includes functionality for: Managing Schema Objects, Cypher Editor, Editable Data Grid, Template Diagrams, Instance Diagrams and Reverse Enginering. We are looking at Nodeera, trying to work with it in practise, and we will write a more elaborate review as time permits.
Nodeera's homepage is here. The company was founded in the US.
Nodeera's homepage is here. The company was founded in the US.
Qlik
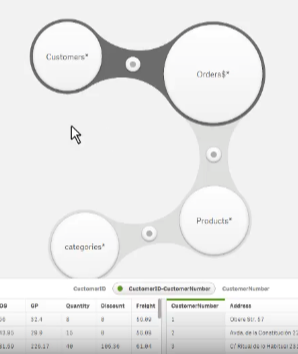
Qlik has an "Associative Engine" in a number of its products:
"Qlik® delivers intuitive platform solutions for self-service data visualization, guided analytics applications, embedded analytics and reporting to approximately 45,000 customers worldwide".
As you can see in the picture on the right, it is a true graph representation of a data model. A very elegant and intuitive tool!
See more here on Youtube: Qlik Sense - Creating a Data Model
Qlik's homepage is here. The company was founded in Sweden, so it is a "New Nordic" software company!
Reltio
Reltio’s mission is to bring the power of self-learning to every business, so they can Be Right Faster. Reltio Cloud delivers enterprise data-driven applications powered by a modern data management Platform as a Service (PaaS), guiding customers to take the right actions, based on the right insights, to achieve the right results.
Reltio was founded on a single premise: Companies who learn faster grow faster. The founder set out to build Reltio with a vision to create a simple way for companies to become continuously organize their data, through a Self-Learning Data Platform that uses data for recommended actions, and then measures results to learn, and improve business outcomes.
See more in this article on Forbes Magazine.
Reltio's homepage is here.
Rulearts
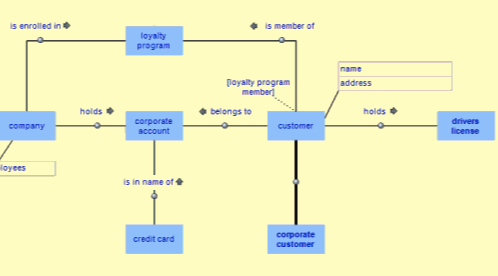
RuleArts was conceived in November 2004 out of a strong belief that technology-independent business rules should be owned by the business. The business should be supported by tools that allow them to verify and validate the rules on completeness and consistency. The development of RuleXpress to fulfill these needs began shortly thereafter. It became the first true Business Rule Management tool for Business People.
FactXpress is a business-focused tool designed to easily create consistent graphical fact models (business models). It is integrated in RuleXpress but can also be used as a standalone product. In this video we demonstrate the interaction between RuleXpress and FactXpress: Fact Modeling in RuleXpress
FactXpress is a business-focused tool designed to easily create consistent graphical fact models (business models). It is integrated in RuleXpress but can also be used as a standalone product. In this video we demonstrate the interaction between RuleXpress and FactXpress: Fact Modeling in RuleXpress
Rulearts' homepage is here. The company is a joint venture of Business Rules Solutions (USA) and LibRT (The Netherlands), now owned by H3R
Structr
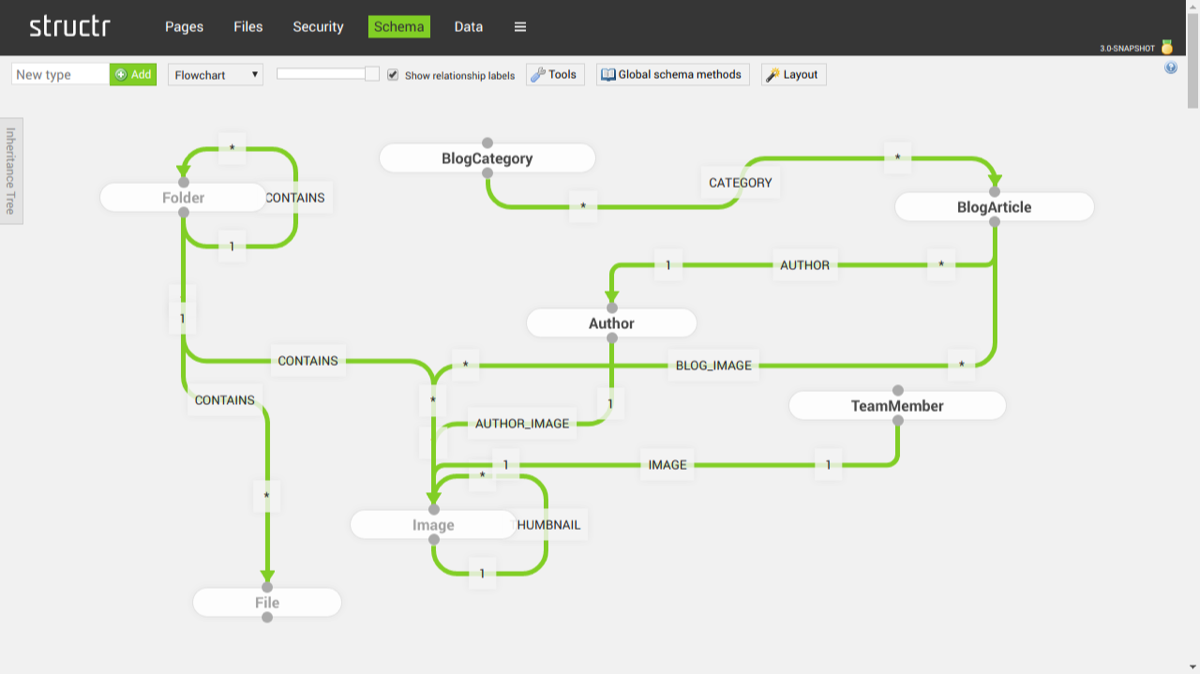
Structr is a leading graph-based low-code development
and runtime workbench for data-centric web and mobile applications. It is an open source project with a commercial option as well.
It includes a Schema & visual data modeling tool, which can create types for objects and relations between them, manage attributes, views and data types and define schema methods for advanced behaviour.
See more here on Vimeo: How to create…
Structure's homepage is here. The company was founded in Germany.
TigerGraph
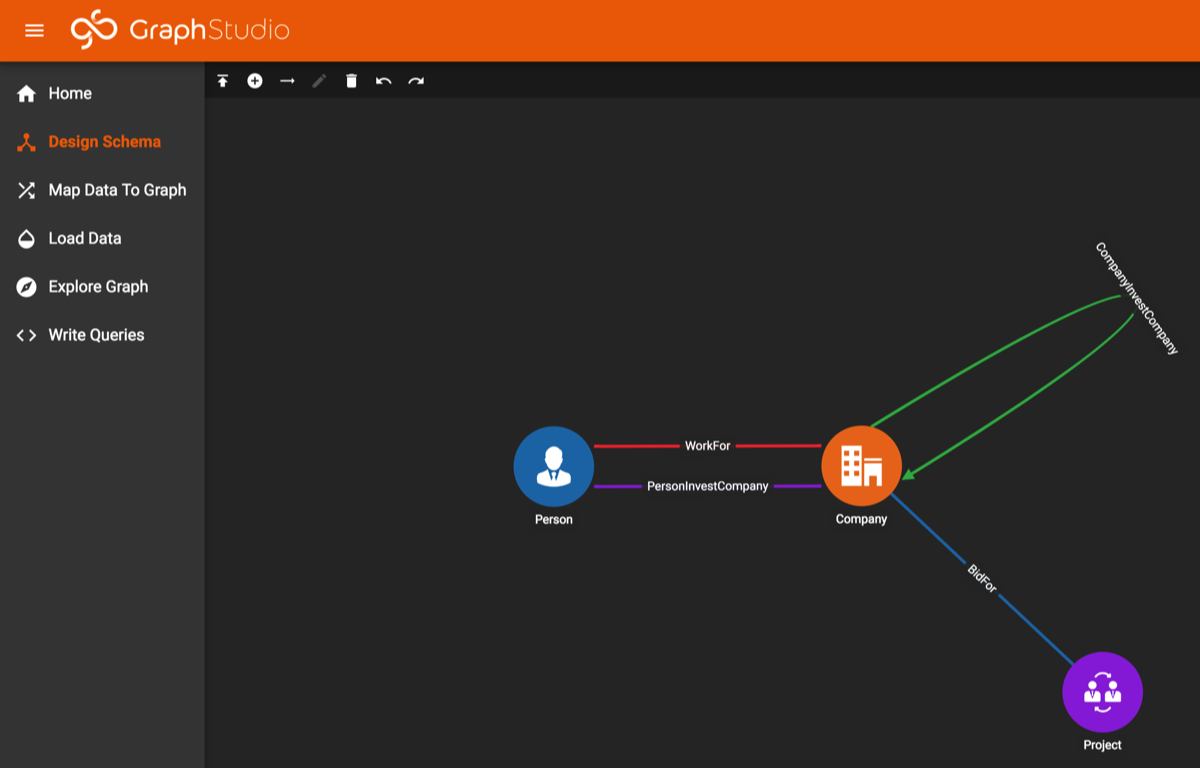
TigerGraph - The Only Scalable Graph Database for The Enterprise
TigerGraph is delivering the next stage in the evolution of the graph database: the first system capable of real-time analytics on web-scale data. Our Native Parallel Graph™ (NPG) design focuses on both storage and computation, supporting real-time graph updates and offering built-in parallel computation.
It's GraphStudio™ is a simple yet powerful graphical user interface. GraphStudio integrates all the phases of graph data analytics into one easy-to-use graphical user interface. It includes Schema Design:
TigerGraph's homepage is here. The company was founded in the US.
TopBraid from TopQuadrant
TopQuadrant’s Mission is to Make Information Meaningful
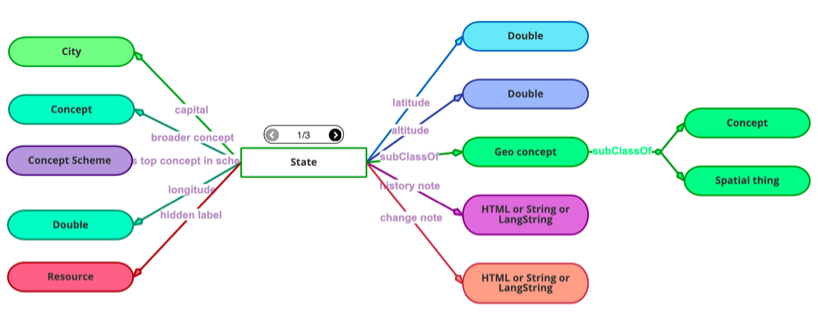
Our flagship product, TopBraid EDG, is a rich set of interconnected knowledge graphs providing a view of how data is used and managed in the enterprise. These integrated knowledge graphs are ready to be enriched with your enterprise-specific knowledge. Post-enrichment, your enterprise is ready for implementing comprehensive data governance. TopBraid EDG intelligently connects all of your information assets.
Model Graphs
We store both types of information in graphs - the schema (shape of the data) and the data. Among other things, this approach makes it possible to provide model-driven guidance on data entry, validate data to ensure that it aligns with the schema and expose model-based graph APIs such as GraphQL with introspection. We differentiate between model graphs and data graphs. All graphs connect to each other.
TopQuadrant's homepage is here. The company was founded in the US.
Unifi
Unifi was founded to satisfy a frustrating industry need.
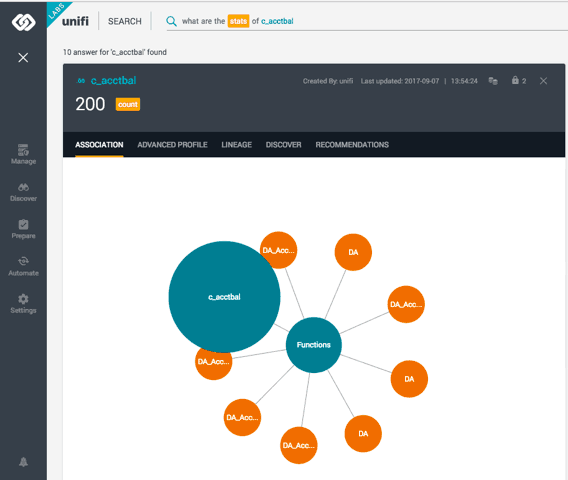
The Unifi Data Platform breaks down the barriers of operational data silos and democratizes information across the enterprise. At the heart of the platform is a comprehensive suite of self-service data discovery and preparation tools to empower business users. Employing machine learning and artificial intelligence technologies, and optimized for the cloud, Unifi predicts what the business user wants to visualize and then connects the resulting data natively to the BI tool for fast, accurate results.
View Data Relationships
Graphically represented by JanusGraph embedded into the Unifi Data Catalog UI, a user can easily determine how datasets and even attributes are related. Understanding where data comes from, the provenance, and lineage are essential to determining data validity.
See more here on Unifi: How to create…
Unifi's homepage is here. The company was founded in the US.
New: Online Training in Graph Data Modeling is now available! Click here:
All the details of Graph Data Modeling are explained in this book: